Recognizing Foreshocks -- Answers

Example #1
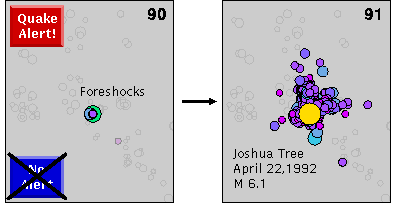
Correct answer: Issue Earthquake Alert!
Sorry, but this animation was, in fact, followed by a large
earthquake on day 91 -- the Joshua Tree earthquake of April 22,
1992, a magnitude 6.1 right-lateral strike-slip fault rupture
which occurred just north of the southern San Andreas fault zone.
You can see it and its numerous aftershocks in the image of day
91 above. The tight cluster of seismicity seen on day 90 was
a group of foreshocks to the Joshua Tree mainshock -- note how
the large earthquake follows them in the exact same location.
Part of this foreshock group was a magnitude 4.6 earthquake
(seen in green), a notable earthquake in its own right.
Select Another Animation
or
Return to the first page of Activity #10

Example #2
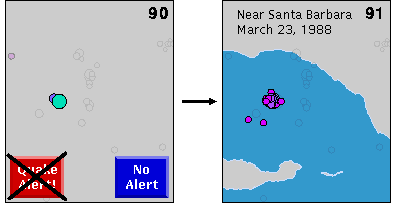
Correct answer: No Alert Issued
This sequence of 90 days was not followed by a large earthquake,
but only a cluster of small aftershocks of the magnitude 4 earthquake
that occurred on day 90. There was no need to issue an earthquake
alert. As you can see, the setting of this animation was primarily
offshore, south of Santa Barbara -- that's Santa Cruz Island at lower
left. Day 91 was March 23, 1988.
Select Another Animation
or
Return to the first page of Activity #10

Example #3
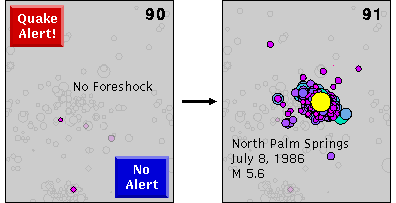
Correct answer: either (see below)
You decided not to issue an earthquake alert on the 90th day, but there
was a large earthquake on day 91 -- the North Palm Springs mainshock,
a magnitude 5.6 right-lateral strike-slip earthquake that struck (as the
name implies) north of Palm Springs on July 8, 1986. However, if you'll
look carefully at the frame for day 90, and then at day 91
(ignore the aftershock "cloud" and concentrate on the mainshock),
you'll note that none of the seismicity on day 90 occurred in the same
location as the North Palm Springs mainshock. That means there were no
foreshocks to this earthquake. In that sense, your decision not to
issue an alert was technically correct, since you were only using
seismicity patterns and foreshock identification as your means of
forecasting earthquakes.
Select Another Animation
or
Return to the first page of Activity #10

Example #4
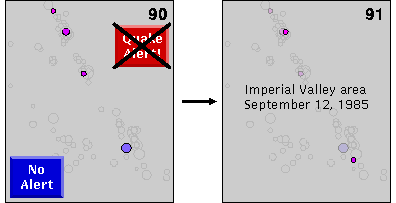
Correct answer: No Alert Issued
No large earthquake followed this animation, a view of the Imperial
Valley of extreme southern California for the 90 days leading up
to September 12, 1985. You may have noticed a linear trend in the
seismicity cutting diagonally across the area -- this is the Imperial
fault zone, one of the most active in all of California. However,
in this animation, and the day that followed it, that activity was
nothing to worry about, and so the correct response to this
90-day sequence was to issue no alert.
Select Another Animation
or
Return to the first page of Activity #10

Example #5
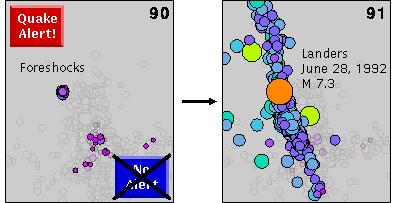
Correct answer: Issue Earthquake Alert!
This animation was actually followed by a very large earthquake --
the largest in southern California since 1952! Day 91 saw
the occurrence of the magnitude 7.3 right-lateral
strike-slip Landers earthquake of June 28, 1992. You can see
the linear fault trace of the Landers rupture clearly outlined
by aftershocks in the image of day 91 seismicity. The site of
the Landers mainshock epicenter is the same as the small cluster
of microseismicity (quakes smaller than magnitude 3) seen just
left of center in frame 90, meaning that those earthquakes were
foreshocks of the Landers mainshock. Theoretically, they could
have warned of the impending major earthquake. Therefore, you
would have been right in issuing an earthquake alert.
The large earthquake that occurred on day 24 and
generated the aftershock sequence that lasted throughout the rest of
the animation was the magnitude 6.1 Joshua Tree earthquake.
That earthquake was also preceded by foreshocks, though because of
the partitioning of "days" in this animation, they aren't apparent.
Given how the Joshua Tree aftershock sequence seems to have led directly
into the start of the Landers activity, the Joshua Tree mainshock could
be considered an advance foreshock of sorts to the Landers earthquake.
Select Another Animation
or
Return to the first page of Activity #10

Example #6
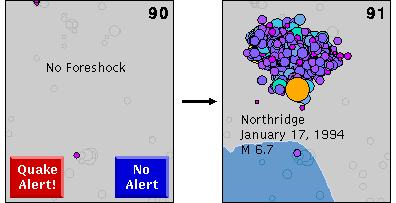
Correct answer: either (see below)
Though a large earthquake struck the area on day 91 following the
animation you just watched, you were justified in not issuing an alert
based upon foreshock activity... because there was none! Sadly,
however, this animation was followed by a large earthquake:
the devastating Northridge mainshock
of January 17, 1994, a magnitude 6.7 earthquake which ruptured
a blind thrust fault northwest of Los Angeles (you
can see Santa Monica Bay at lower left on the day 91 image).
Still, had you announced an alert, your methods would probably be
the subject of much suspicion. After all, how could you have forecast
an earthquake based on foreshock activity, if that earthquake had no
foreshocks? It would have been obvious that you were simply guessing.
So don't feel too bad that you missed this large earthquake's impending
arrival... with only seismicity patterns to go on, there was no way to see it
coming.
Before you move on, did you notice the pattern of aftershocks
associated with the Northridge mainshock in the day 91 frame?
Given that this earthquake occurred on a thrust fault striking
roughly east-west, and that the hypocenter was located near
the base of that fault, which way does that fault dip?
Select Another Animation
or
Return to the first page of Activity #10


Return to the first page of Activity #10

![]()

![]()

![]()

![]()

![]()

![]()