For today's activity, we would like to make a map of earthquake locations and compare them with location and type of plate boundaries on a global scale. We have talked about how plate tectonics is responsible for the stresses that lead to the elastic rebound process and eventually result in earthquakes, but it is important to see what the actual spatial relationship is. To do this we will take advantage of our previous experience making maps of plate boundaries and use an earthquake catalog to plot epicenters for comparison.
We have already made a map of plate boundaries from one of our last tutorials. We can use the script we generated for that tutorial as the basis for today's activity. First make a new directory called act9 inside your groupwork directory. Now copy the script file from our plate boundary activity called platebound.csh to a new file called eq.csh in the act9 directory. Since it has been several weeks since we last used these files, you will probably have to check to see where this older script file is located.
Once the eq.csh file has been created, go ahead an open it with emacs so that we can adjust it for the current activity. First look at the commands that are already inside the script file. Do you recall what the purpose of each line was? The first thing you will want to do with this new script is to change the output filename for each line from platebound.ps to eq.ps. The second thing is that now we are in a different directory from where our plate boundary files were generated. We can tell our new script where those files are relative to our current directory by putting ../act8/ directly in front of ridge.gmt, transform.gmt, and trench.gmt. For example, one of the lines should look something like this:
psxy ../act8/ridge.gmt -JM7 -R-180/180/-70/70 -M -W3/255/0/0 -K -O >> eq.ps
It is also important to remember why the -K, -O, >! and >> options change from line to line.
Today we would also like to add a new line to our script that will plot earthquakes on the map. A large earthquake database file can be found at:
/chiapas/mikeb/database/engdahl/EHB.64-04.sea
You can use more to look at this file, but you do NOT need to copy this file to your current directory. This format for this file is:
year month day hour minute second latitude longitude depth magnitude-type magnitude
For the current activity we just want to plot the earthquake locations, so we only need the longitude and latitude of the earthquakes listed in this file. Also, this is a file of over 100,000 earthquakes, so it would help to choose a set of better located earthquakes instead of plotting all earthquakes in the catalog. A simple way to do that is to limit the earthquakes those with magnitudes of at least 5. If you recall, we can use awk to extract the information we need from this file:
awk '$11>=5{print $8,$7}' /chiapas/mikeb/database/engdahl/EHB.64-04.sea >! eq.gmt
You can type this at the command line to generate an earthquake datafile that is ready to be used by the GMT command psxy.
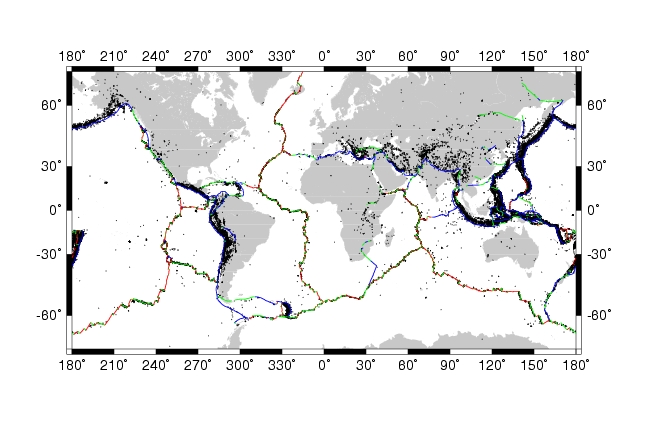
For this exercise, add a psxy command to your eq.csh script that will plot the contents of your eq.gmt file with a small circle symbol (-Sc.01). It should use the same -JM and -R options as other psxy commands in your script. Also remember that each GMT command successively adds things to your plot or map, so the order of your commands will determine whether the earthquakes are plotted on top of or below the plate boundary lines. The final output map should look something like this.
How are earthquakes related to plate boundaries? Do earthquakes have different relationships to the different kinds of plate boundaries? Why? Store your answers to these questions in a file called eq.txt in your act9 directory.
![]()
![]()
![]()
brudzimr@muohio.edu, © 16th October 2006