For today's activity, we would like to use plate boundaries to determine the euler pole of rotation for the motion between two plates. Ridges and transform faults are good indicators of plate motions. For ridges, the euler pole falls on a line parallel to the ridge. For transform faults, the euler pole falls on a line perpendicular to the transform fault. If we draw a whole set of these lines based on various ridge and transform features, we can approximate the location of the euler pole. We will do that today for the motion between the North American and Eurasian plate.
We have already made a map of plate boundaries from our last tutorial. However, it turns out the Euler pole for the motion we are interested in is near the North pole, but this map is in the Mercator projection which has difficulty plotting areas near the poles. To remedy this problem, we will learn how to plot a map of the Northern Hemisphere using an Orthographic projection.
The orthographic projection basically shows a hemisphere view of the Earth, as if you were looking at the globe from a far distance away. Since the map we will want to make should have all of the items plotted as our last tutorial but with a different projection, it would be helpful just change the projection settings in your script file (this is why script files are a great help to programmers). Let's go to your act8 directory and copy your script file platebound.csh to a new file called ortho.csh. This will allow us to edit a version of your script (ortho.csh) while keeping an old version of it (platebound.csh) in case you need it again later. Go ahead and open ortho.csh for editting.
The main thing we need to change in the script for the projection to change is your -JM options in this script. We need to use the -JG option instead. The format for this option is a little different than -JM
-JG(center-longitude)/(center-latitude)/(X-axis-size)
So instead of just specifying the size of the map (i.e., -JM7), you will also need to specify where the projection should be centered since the proejction can only show one hemisphere at a time. Since we want the northern hemisphere, the center should be the north pole. You can specify the north pole with any longitdue and 90 degrees latitude. So an example of the -JG format you can use is in your new script: -JG0/90/7. You should use something like this to replace all of your old -JM options in your ortho.csh script file.
There are two additional things to change in your script. First, the -R needs to be changed so that the Y limits go all the way to 90 degrees (they probably only went to 70 degrees before). It is also very important that you replace the old output filename (platebound.ps) with a new one (ortho.ps) through out your script file. This will make sure that when you run your new script you don't overwrite you old output file (in case you want to look at it again later).
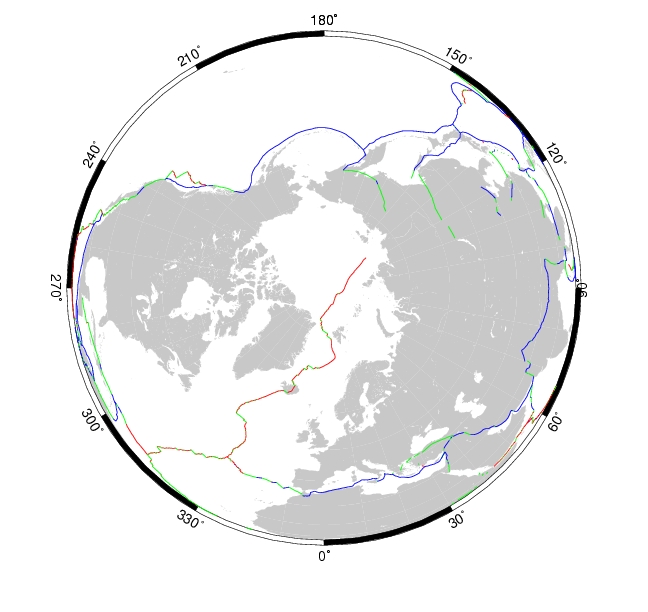
When you run your new script you should end up with a plot like this.
For the exercise in this tutorial you will need to draw by hand on this figure, so you should print it out on the printer. Do you remember how? You may want to review the end of Tutorial 3 to see how we did this in the past. To help you out since it has been a while, here is a command to accomplish this today:
lpr -Pshd17 ortho.ps
For this exercise you need to draw lines on your map to estimate where the Euler pole is for motion between the North American and Eurasian plates. Review section 14.1 above to see how you should draw lines using the ridges and transform faults between the North American and Eurasian plates. It may be difficult to see the color difference on the map you printed on the non-color printer, so refer to the image on screen to help decide which plate boundary is which. Please note that when you draw the lines they will NOT all intersect at one point (it is only an approximation of the Euler pole). Nevertheless, I would like you to circle the location that best approximates the Euler pole.
-JG(center-longitude)/(center-latitude)/(X-axis-size) |
GMT option to plot an orthographic projection |
![]()
![]()
![]()
brudzimr@muohio.edu, © 12th September 2006