An important mathematical function for scientists is ex, since we can use it to describe relationships between different properties. For today's example we are interested in understanding the Arrhenius relationship, which is represented by e1/x. This is important for understanding the Earth as it describes the relationship between temperature and the mechanical strenght of earth materials.
You have already learned that awk has some advanced mathematical functions like sin(), cos(), and atan2(), so it may not be a surprise that it also has a function exp() to calculate ex. To use this function, we simply need to specify exp(value) within awk. For example, specifying {print exp(1)} as our awk program will print out the value 2.71828 which is e1.
To view what the Arrhenius relationship looks like, we can use exp() to make a plot of the e1/x function. However, awk takes a file as input and calculates things for each line. How should we set up our awk program to plot the e1/x function for a variety of x values? It would be good if we could generate a input file for awk that has a wide range of x values and let awk calculate the e1/x function for us. We could just type in all of the x values into an input file, but there is an easier way to generate this series of x values...
Perhaps the easiest way to cycle through a range of x values is to use a loop within awk. A loop is where a program is asked to repeat a task (or tasks) several times until some condition is met. This is a key component of many computer programs because having a computer loop through a series of tasks many times is much easier and less time consuming than us doing it by hand. We can do a loop in awk by using the for() function. The format of the for() function is:
for(initial condition; continuing condition; loop increment) command
There are 4 things we need to specify so that for() knows how to do our loop: what to do at the start of the loop (initial condition), how to decide if the loop should contine through the next cycle (continuing condition), what to do at the end of each cycle through the loop (loop increment), and what to do during each loop cycle (command).
For our example, we need to decide on the range of x values and how often we want to evaluate the e1/x function. To begin with, we can evaluate from -10 to 10, incrementing though every 0.1 units. And to best use awk, we should specify these values in an input file called arrhenius.in. You may recall, there are several ways to put text into a file (see Tutorials 3 or 5 if you're not sure). As usual, you should keep the files you generate during this tutorial in a new directory, so today we should make a new one called act7 in your groupwork directory. Within that directory you will want to create the arrhenius.in file to have one line that says:
-10 10 0.1
Then we can read this file into awk and use the values to set up our for() loop. The initial condition will be to set a variable called x to -10. The continuing condition will be that x is less than or equal to 10. The loop increment will be to add 0.1 to x. The command we will perform for each loop is to print out the x value and the exp(1/x) value. So when we write out our awk program on the command line we will call the first, second and third columns ($1, $2, $3) of our input file to specify the for() conditions. Lastly, we will store our output in a new file called arrhenius.out. The full command should be:
% awk '{for (x=$1; x<=$2; x=x+$3) print x,exp(1/x)}' arrhenius.in >! arrhenius.out
Did you get an error message? It might look something like this:
awk: (FILENAME=arrhenius.in FNR=1) warning: exp: argument -5.32183e+13 is out of range
This error is caused by awk trying to evaluate exp(1/0) when x=0. As I'm sure you are aware, 1 divied by 0 represents infinity, so awk has some trouble dealing with that (don't we all have trouble dealing with infinity!). Now check your output file to see if it produced output for all the other values of x. It should have just skipped the value for 0 (that's fine), and the final 5 lines should look like this:
9.6 1.10979
9.7 1.10859
9.8 1.10743
9.9 1.10629
10 1.10517
You may be able to notice trends in the output file just by looking at the second column of your output file to see how it varies for different values in the first column. To help us see the trends, we can make a simple plot of the results with psxy. Since we have used psxy a few times now, I'm hoping that you are learning how to use the different options. I'd like you to choose the values for the options this time, but I will help you with the general format of the command to make a plot of our output file:
psxy arrhenius.out -R(range of X and Y values) -JX(plot size) -B(tickmarks) -S(symbol type) >! arrhenius.ps
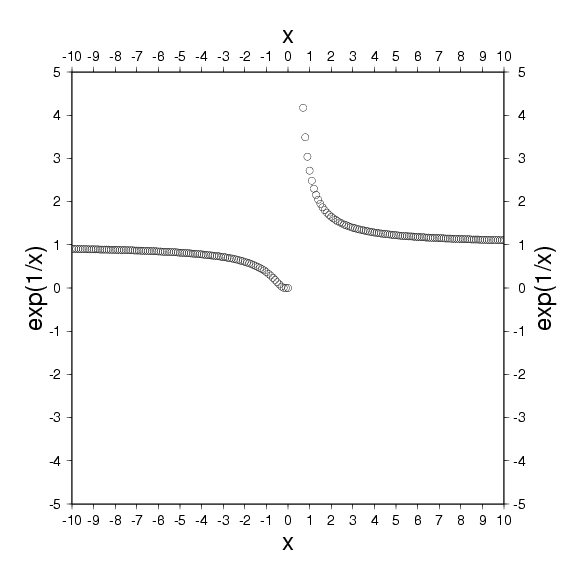
You will need to choose the values for -R -JX -B and -S. You may need to refer to Tutorial 9 to refresh your memory on what the format is for these options and to see how we have used them in the past. Good luck and please ask for help if you get stuck. Your plot should look something like this but it probably won't match exactly since you may choose different options than I did.
Taking a look at your output, I would like you to describe the e1/x function. What is the limit as x goes to large values? What is the limit as x approaches 0? Are these limits different if x is positive or negative? Where is the largest slope for this function? In class we talked about the Arrhenius relationship when describing the yield stress as equal to exp(Q/RT). So as T increases, what happens to the yield stress (and mechanical strength of the material)? Store your answers to these questions in a file called arrhenius.txt.
exp(value) |
awk function to calculate the exponential of value |
for(initial; continuing; increment) command |
awk function to loop through command |
![]()
![]()
![]()
brudzimr@muohio.edu, © 13th September 2006