In this activity, you will get to try a useful set of global seismology programs collectively called the TauP Toolkit. The various programs can be run on the command line to produce arrival time tables, travel time curves, ray path plots, and expected locations where seismic waves interact with boundaries inside the Earth. These program use a built in velocity model for the average Earth that allows it to make predictions of arrival times and locations. We will use taup_curve to produce a plot of a travel time curve for P waves and then we will use taup_path to plot the ray paths for a P waves at a particular distance. To begin, please make a new directory act10 in your groupwork directory and cd into that directory.
To generate a plot of travel time curve, we will use taup_curve. You can see the options for this command by typing this on the command line:
taup_curve -help
In this case, we will want to use the -ph option to specify P waves. We will also use the -h option to specify a depth of 0 km (at the Earth's surface). Lastly, we will use the -gmt so that the output of this program will be a GMTscript that we can run to make a postscript plot. In other words, TauP will do the work for you to produce the psxy commands that it will take to illustrate the travel time curve. Nice, eh? So here is what your command line options should look like:
taup_curve -ph P -gmt -h 0
Once you run taup_curve, a new file called taup_curve.gmt should be created in your directory. This is the GMT script. To make it an executable script and then run it on the command line, please type:
chmod +x taup_curve.gmt
taup_curve.gmt
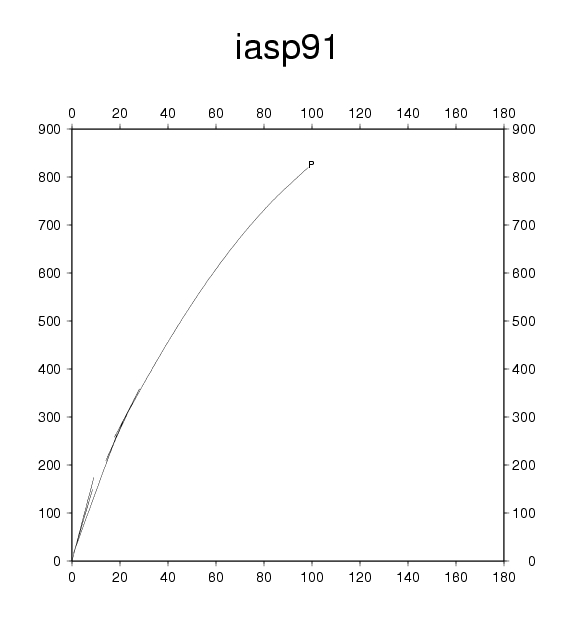
The output of this script will be a file called taup_curve.ps . You can look at this postscript file in the same way as your other GMT output plots. It should look something like this.
This plot shows a travel time curve for P waves with distance in degrees on the X axis. What should the Y axis be labeled? Looking at the travel time curve, you should notice there are a number of features at distances less than 30 degrees. What are these features? What do they tell us about the Earth? Store your answers to these questions in a file called taup_curve.txt.
You may have noticed that the travel time curve in this last exercise only went up to a distance of about 100 degrees. We should take a closer look at why this happened. To do so, we can plot the ray paths for P waves that travel about 100 degrees in distance. We will use the taup_path program to make this plot. As with taup_curve, please use the -help option to list the instructions for this command. We will use the same -h 0 and -gmt options, but we will adjust the -ph P option to -ph ttp in order to get all possible P wave variants no matter how they might interact with boundaries in the Earth (I like to think of ttp standing for ToTal P). In this case, we will also use the -deg 100 option to specify ray paths that go 100 degrees to help us understand why the travel time curve stops near that distance. Your command line options should look something like this:
taup_path -ph ttp -deg 100 -gmt -h 0
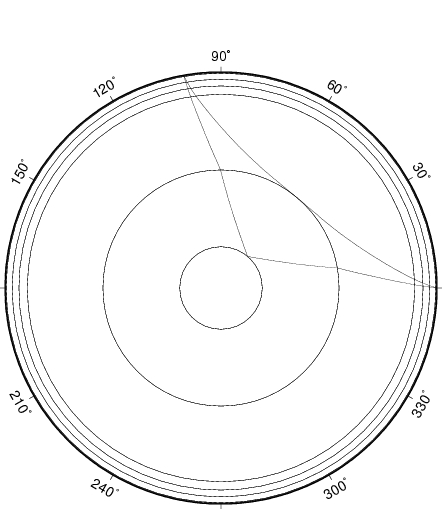
After you run this command, a new file called taup_path.gmt will be produced. You will want to use chmod to make this executable and run this. The output from the GMT script will be a file called taup_path.ps , and you should be able to view this plot as before. It should look something like this.
This plot shows the P wave ray paths if we were to slice the Earth in half. Some of the Earth's major boundaries are marked as concentric circles in this view. Which boundaries are the P wave ray paths interacting with in this plot? Which of these layers is expected to have the greatest impact on seismic velocities? How would this help explain why the travel time curve ends at 100 degrees? Store your answers to these questions in a file called taup_path.txt.
taup_curve options |
TauP program to produce travel time curve plots |
taup_path options |
TauP program to produce ray path plots |
![]()
![]()
![]()
brudzimr@muohio.edu, © 12th September 2006